Foodservice and packaged beverages now account for 60.8% of in-store profit dollars. Nearly half of all convenience store trips include a beverage purchase. Beverages generate 40%+ net margins, outperforming many other inside categories.
For facilities leaders, that means one thing: beverage equipment is no longer just another trade category. It is revenue infrastructure.
As specialty beverage programs expand, from bean-to-cup coffee to frozen dispensed drinks and energy drink cooler expansions, facilities budgets are quietly being reshaped. The cost pressure does not show up immediately in capital planning. It shows up later in reactive spend, HVAC strain, plumbing failures, electrical loads, and recurring service calls.
The Revenue Reality Behind Beverage Programs
The economics are clear. Foodservice and packaged beverages drive the majority of inside profit. Beverage shoppers visit frequently and produce high-margin transactions. Foodservice and Packaged Beverages Account for 60.8% of In-Store Profit Dollars as shown in the graph below.

Coffee specifically is an area where customers are willing to pay more for a better experience. Loyalty programs, now present in 73% of convenience stores, often center around beverage rewards, increasing machine utilization and throughput.
Higher utilization translates directly into higher wear and tear.
For facilities teams, this means:
• More grinder replacements
• Increased boiler and heating element failures
• Higher water filtration replacement frequency
• More drain line clogs
• Electrical panel load increases
• HVAC systems compensating for additional heat loads
These are not isolated costs. They compound.
The Hidden Facilities Impact of Beverage Expansion
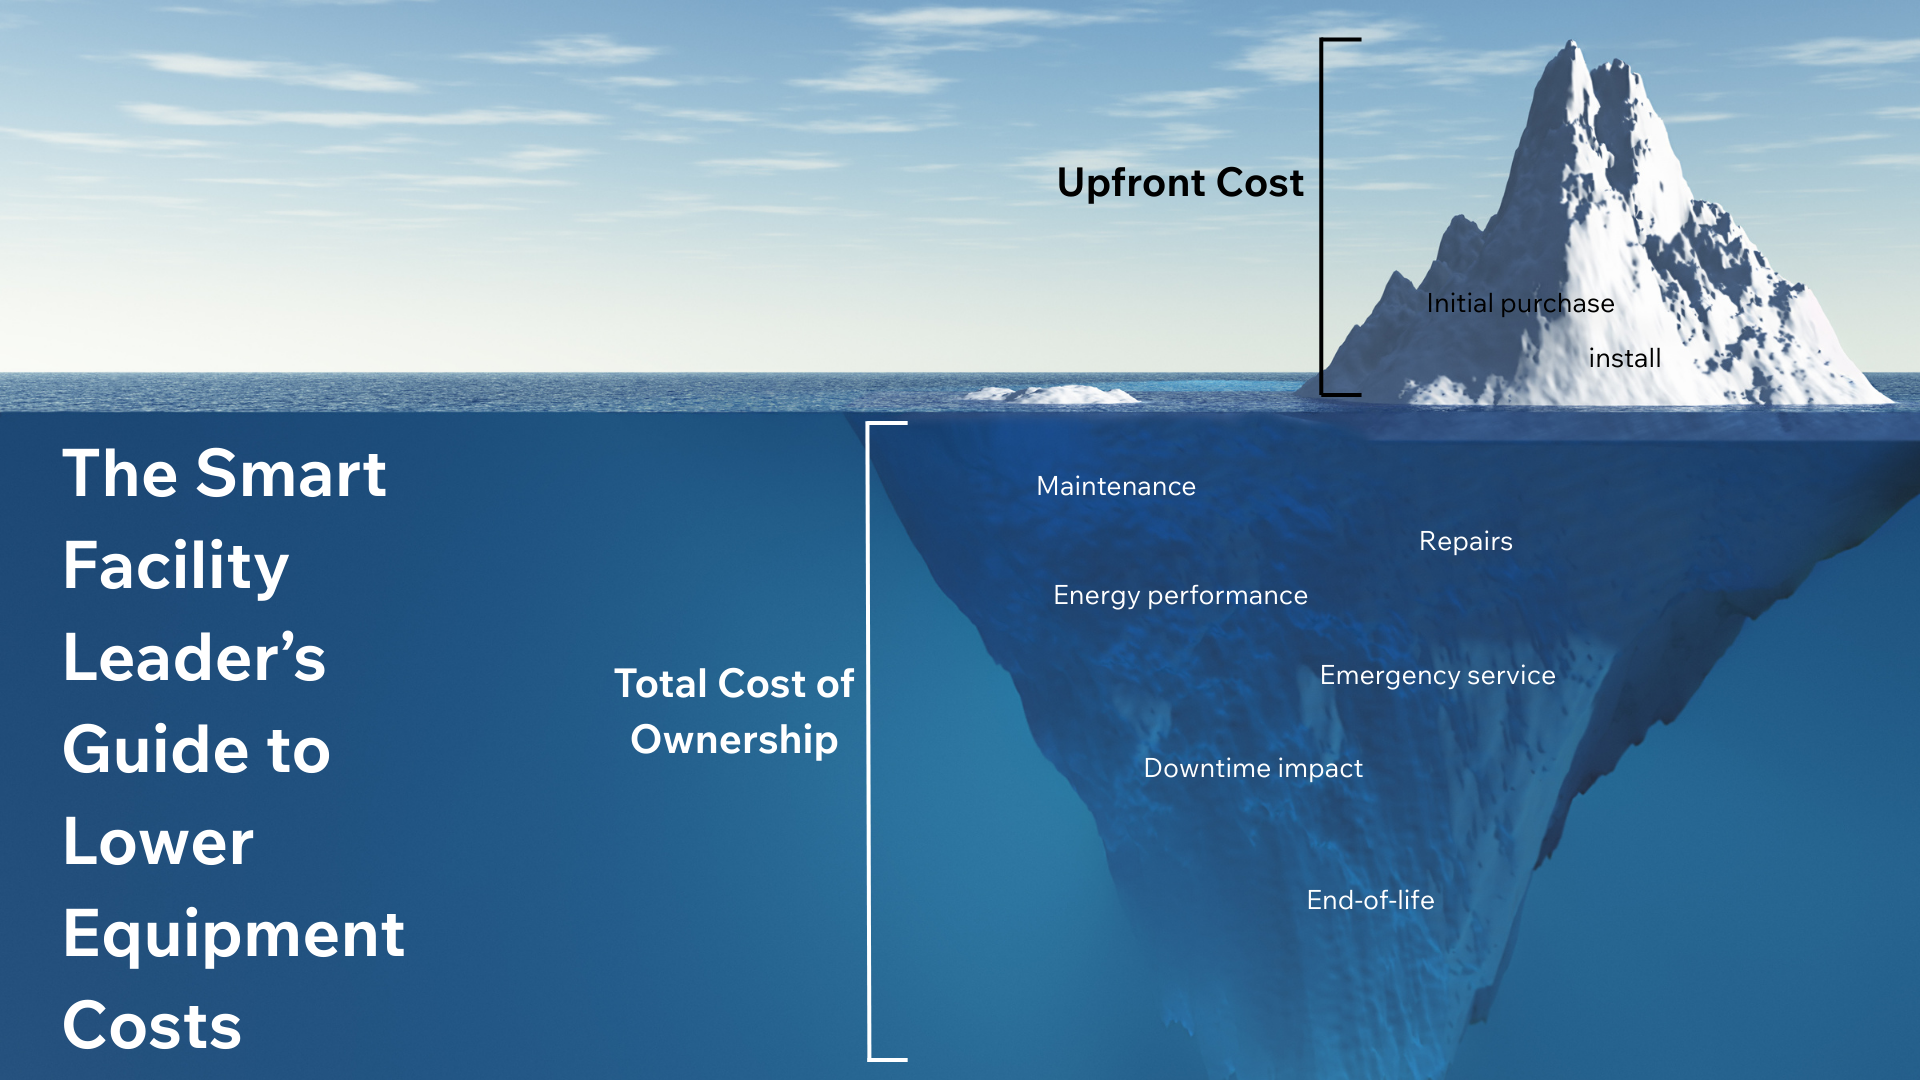
Many beverage rollouts are justified on margin expansion. Few are modeled through a Total Cost of Ownership, or TCO, lens.
Bean-to-cup systems offer labor efficiency and perceived quality benefits. However, they also introduce:
- Higher upfront capital
- More complex internal components
- Increased cleaning requirements
- Sensitive calibration needs
- Water quality dependencies
If commissioning is inconsistent across locations, service variability increases. If preventive maintenance is not standardized, repair volume spikes in year two and three.
Facilities leaders often see this pattern:
Year 1: Installation and initial PM discovery
Year 2: Rising reactive work orders
Year 3: Outlier stores driving disproportionate spend
In distributed portfolios, the top 10% of stores often account for 25% or more of total maintenance spend. Beverage-heavy locations amplify this dynamic.
Downtime Is a Revenue Event
Unlike back-of-house equipment, beverage downtime is customer-facing.
If a signature coffee machine is down during morning rush, the revenue impact is immediate. Given 40%+ net margins, even short outages materially affect profit per store per day. Beverage Net Margins Significantly Outperform Many Other Inside Categories such as even alcohol.

In high-volume locations running multiple units per site, even a single inoperable machine reduces transaction speed, basket attachment, loyalty engagement, and perceived store quality.
Why Reactive Spend Creeps Up
Three common drivers are emerging in beverage-heavy portfolios:
- Recall and Duplicate Work Orders
Incomplete root cause fixes lead to repeat service calls within 30 days. Without structured recall flagging and provider accountability, billed volume rises. - Materials Markup and Line-Item Creep
Specialty beverage parts are frequently billed with limited transparency. Without invoice validation, parts inflation quietly increases cost per work order. - Misaligned Prioritization
Not every beverage issue is a Priority 1. Over-prioritization increases overtime, expedite fees, and truck rolls.
In inflationary environments, service providers increase revenue through labor duration expansion and materials markup. Without structured audit controls, beverage programs become margin leaks.
Facilities Strategy for Specialty Beverage Growth
Facilities leaders should approach beverage expansion with five guardrails:
- Standardized Installation and Commissioning
Consistent install practices reduce long-term variability and callback rates. - Asset-Level Tracking
Every unit should be individually tracked for repair frequency, parts history, and lifecycle stage. - Preventive Maintenance Alignment
High-throughput beverage units require higher preventive maintenance cadence. Under-maintained machines revert to reactive baselines quickly. - Invoice Audit and Labor Validation
Validation of time on site versus billed hours is critical for complex beverage repairs. - Outlier Site Identification
Top 10% high-volume beverage sites should receive targeted oversight and root cause review.
When facilities organizations manage beverage equipment proactively, they protect the 60.8% of profit dollars driven by foodservice and packaged beverages.
The Strategic Shift
Specialty beverages are no longer a merchandising decision alone. They are a facilities strategy decision.
The question is not whether to expand beverage offerings. The industry data supports continued growth.
The question is whether facilities programs are structured to support that growth without eroding margin through uncontrolled reactive spend.
Facilities leaders who align beverage program expansion with Total Cost of Ownership modeling, preventive maintenance discipline, and invoice transparency will protect both revenue and budget.
Those who do not will see beverage growth show up quietly in their repair and maintenance line item.
Frequently Asked Questions
How do specialty beverage programs impact facilities budgets?
They increase asset complexity, utilization rates, HVAC load, plumbing demand, and reactive service volume. Without preventive maintenance and invoice controls, repair spend rises disproportionately.
What is the biggest facilities risk with bean-to-cup coffee machines?
Inconsistent commissioning and insufficient preventive maintenance cadence. These machines have higher internal complexity and water quality sensitivity, increasing recall risk if not maintained properly.
Why is beverage equipment considered revenue-critical infrastructure?
Nearly half of all convenience store trips include a beverage purchase and beverages generate 40%+ net margins. Downtime directly impacts inside profit and customer loyalty.
Want to talk facilities?
Leave a comment or question below and we'll reach out!